Scope of Financial Analytics
With the proliferation of corporate open data, driven largely by governmental regulation across the globe, there is no shortage of information for business analysts looking to glean valuable insights and better understand the corporations and institutions they care about. Subsequently, all such entities mandated to submit documents, statements, and reports relating to their business activities are doing so in a bid to increase transparency and improve stakeholder confidence in the process.
Financial analytics is a key function in most organizations whether to analyze internal performance or compare that to peers. It involves scrutinizing financial data, both past and present, to predict with reasonable certainty, expected revenues and expenditures in the future.
Whether it is forecasting a return on investment for a novel venture, writing financial reports to better inform decisions, or collating industry research to understand competition, financial analysts need to work with a large amount of data. This can help them understand trends that, for example, affect a specific product type, geographic region, or industry, all in the quest to understand the dynamics of the business better.
This can aid them in building more robust financial models, exploring investment opportunities, establishing, and evaluating profit plans, evaluating critical metrics like CAPEX and depreciation, and much more. While this used to be a tedious activity until not very long ago, the advent of open data standards like XBRL has made analysis and comparison extremely quick and simple.
In our next section, we briefly examine how this has been made possible.
Using XBRL for Financial Analytics
The XBRL or eXtensible Business Reporting Language is an XML (eXtensible Markup Language) derivative specifically built to support business reporting including the preparation, dissemination, and analysis of financial (and now non-financial) reports, statements, and audits schedules. It essentially labels business data using machine-readable code picked from standard lists, also known as taxonomies making it easier for analysts, investors, and auditors alike to locate and analyze the desired information.
So how does the XBRL standard achieve this? Let us begin by briefly exploring its elements.
As mentioned previously, the XBRL specification consists of an XBRL Taxonomy that is used to classify the contents of business reports, statements, and documents providing the foundation for standardized business reporting. Having a standard list of business reporting concepts ensures that the final output looks and reads largely the same and doesn’t vary wildly between two or more entities.
Fixing a particular concept to a line item or fact (like Total Assets) is known as tagging in XBRL parlance. While most taxonomies make room for entity-specific disclosures using extensions that allow for the tagging of non-standard line items, the bulk of the report is tagged using the reference taxonomy made available by the regulator or appropriate governing body.
Taxonomies contain within them a Schema at the very core that contains element definitions and Linkbases that provide more granular information forming part of those definitions. These concepts can be explored in more detail here.
Now that we have a working understanding of XBRL and how its dynamic nature lends itself seamlessly to financial analysis, let us briefly look at how it is used for fundamental analysis.
An IRIS CARBON® API for XBRL Comparisons – IRIS XCompare
An API or an Application Programming Interface is a contract of service between two applications, or software that provides a distinct function. It defines the manner and flow of communication between the two, using calls and responses. This is usually accompanied by documentation that outlines the structure of these requests so that users know how to use them to effect a specific outcome.
To facilitate the seamless comparison of iXBRL-tagged reports from one year to the next, we have developed an API using proprietary algorithms that is available to the public. It can compare the current iXBRL filing of a company with that of the previous year to understand and evaluate if tags have been applied correctly and if there are any new additions.
This has the potential to greatly reduce the amount of time spent manually reviewing an iXBRL report and ensuring that tags, dimensions, and the overall consistency of the document haven’t changed significantly from one year to the next.
Dubbed IRIS XCompare, this tool can be accessed online at prediction.testcve.testcve.www.iriscarbon.com and currently works for iXBRL documents with XBRL support to come soon. The tokenization of facts forms the backbone of this tool, and it is capable of not only showing exact tag matches but also intelligent tag suggestions based on past publications. Apart from this, it also provides a figure for the accuracy of tags that is a function of exact matches and the total number of tags. The image below shows how this tool works for a company comparing iXBRL reports from one year to the next.
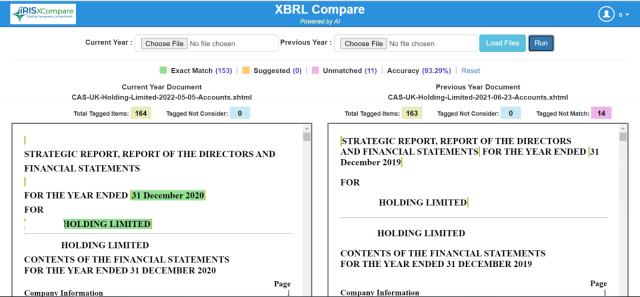
Image 1.1.: IRIS XCompare for comparing iXBRL tags year-on-year
This tool is already in use by some of our name partners and has already shown promising results as far as savings in time and costs are concerned. Our in-house prowess in conceiving and developing such XBRL-based tools is a testament to almost two decades of experience in this space as a leading pioneer of electronic reporting solutions.
The Future of Financial Analytics Using IRIS CARBON® APIs
The use of XBRL for business reporting presents us with limitless opportunities to delve deeper into the numbers and extract valuable insights by way of comprehensive internal and external benchmarking. Apart from bringing transparency to corporate reporting and public spending, it helps public and private sector entities realize immense time and cost savings.
At IRIS CARBON®, our relentless commitment to innovation and automation is responsible for many exciting explorations that our technical and R&D teams continue to work on. Among the many interesting use cases in the pipeline is a tool for XBRL analytics that will allow for comparisons between two or more entities with entirely customizable fields.
Besides our Data Consumption Platform that can be used to bring in the data and generate tailor-made reports, external integrations are also on offer allowing one to use it within a chosen environment.
These REST APIs will work with any database that conforms to the XBRL 2.1 specification and is structured in a way that allows XBRL details to be returned as objects that are used for XBRL data classification. Each object has multiple properties that can be used to define a query and while some are shared properties, others are unique to the object. Nesting of objects can also be achieved, allowing for the retrieval of specific information about the main object.
With ESG reporting slowly coming into the fold of XBRL reporting, the future of non-financial analytics using XBRL-tagged ESG reports also holds a lot of promise. With rapid development in this space, it is only a matter of time before we see corporations and institutions use these tools in interesting ways.
